When managing Sales or Fulfillment Channels in techOMS, you might need to check the activity logs to find specific issues, system actions, and messages. Logs record create, update, and delete actions performed through the UI and API, import and sync actions, and background jobs.
This guide covers how to access, filter, and review channel logs, including how to inspect the JSON payload for advanced troubleshooting.
 |
Make sure that you are operating at the right Vendor/Warehouse beforehand:
|

| |
The screenshots in this article depict Sales Channels for illustrative purposes, but the layout and steps are identical for Fulfillment Channels. The times and dates expressed in the logs are based on the account's time zone. By default, techOMS displays records from the last 7 days. For more details, refer to: Understanding Default Date Filters [Information].
|
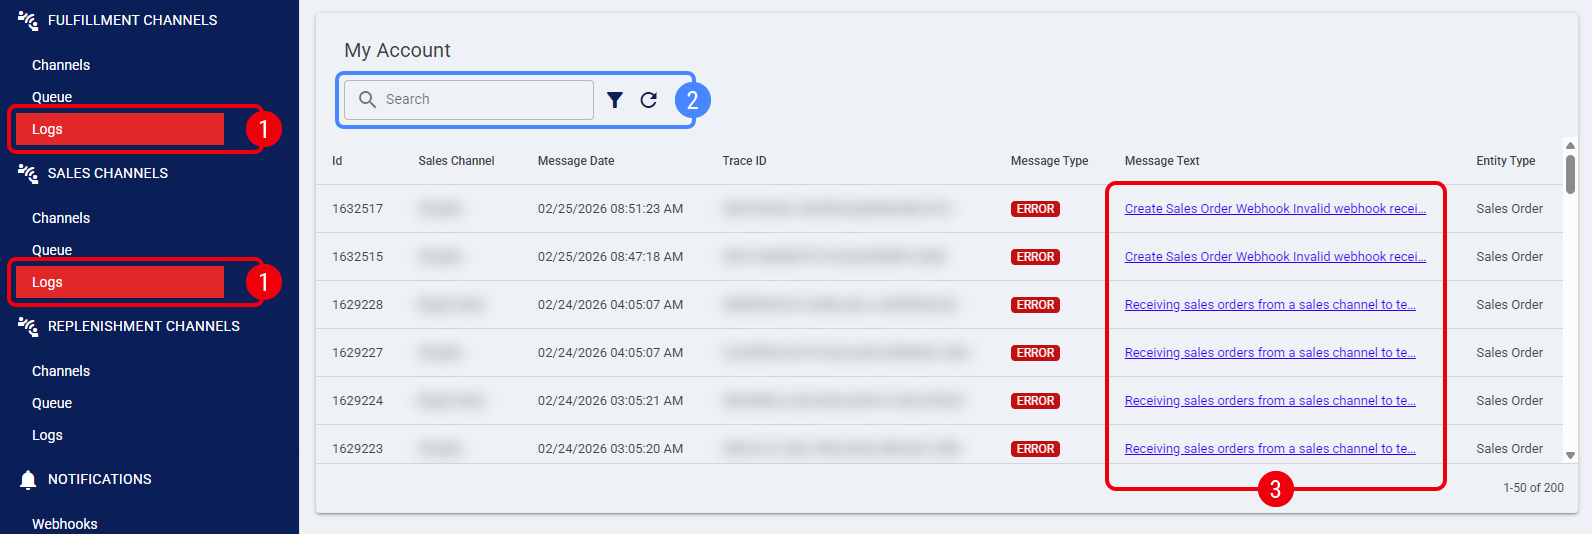
 | Click Logs from the left menu under the Sales Channels or Fulfillment Channels sections. |
 | Optionally, filter the information using one of the following methods: |
- Quick Search: Enter a value in the search bar to look up an ID or any part of the message text.
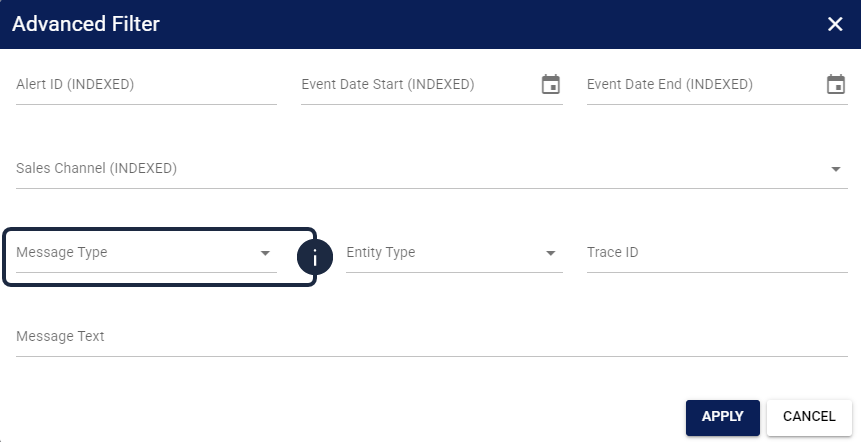
- Advanced Filter: Click the filter icon next to the search bar to apply an Advanced Filter.
| |
When filtering by Message Type, keep in mind the following classifications:
|
 | Click the Message Text field of a log entry to review its details. |
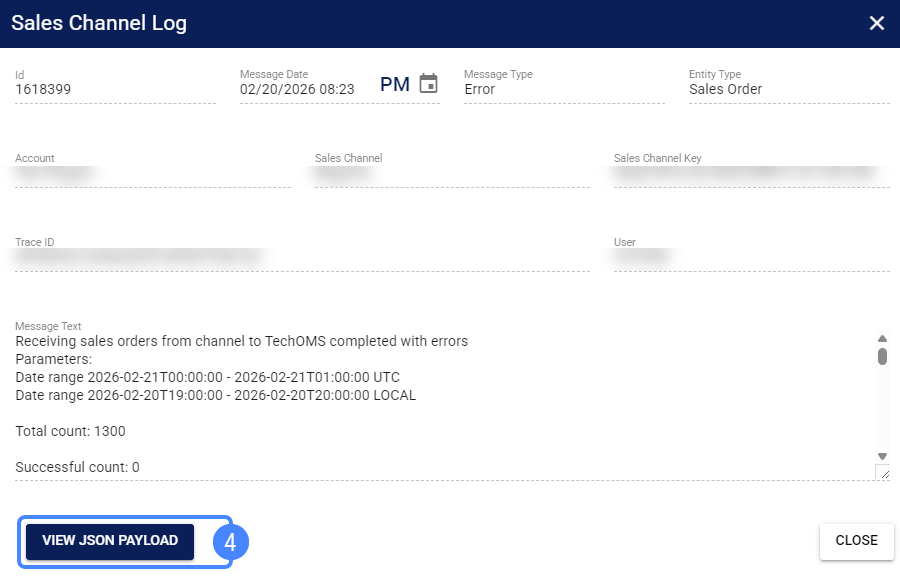
A dialog box will open displaying the log entry's details. Look for keywords related to the case you are investigating.
| |
Depending on the specific integration, techOMS may dynamically display supplementary diagnostic sections for both successful and failed operations. Look for a Receiving Message section (which explicitly lists skipped orders and the reasons they were bypassed during an import) or a Confirmation Message section (which details the exact response received when confirming statuses back to the Channel). If the integration does not provide supplementary messages, these sections are hidden.
|
 | Optionally, press View JSON Payload to troubleshoot the raw data. |
A new dialog will appear displaying the raw JSON request and response data associated with the log entry. Press Close to exit.
After completing these steps, you will have successfully reviewed the channel log details and the underlying JSON payload data, allowing you to troubleshoot integration issues or confirm successful transactions.
Was this article helpful?
That’s Great!
Thank you for your feedback
Sorry! We couldn't be helpful
Thank you for your feedback
Feedback sent
We appreciate your effort and will try to fix the article